Optimize and deploy model on Nvidia Triton server#
To better understand the context of this demo, check Hugging Face Transformer inference UNDER 1 millisecond latency
This folder contains scripts to run different benchmarks:
triton_client.py: query the model with a stringtriton_client_model.py: query the model directly (without using the tokenizer) with numpy arraystriton_client_requests.py: query the model directly (without using the tokenizer) with numpy arrays using onlyrequestslibrarytriton_client_tokenizer.py: query the tokenizer onlyfast_api_server_onnx.py: FastAPI inference server to compare to Nvidia Triton
Infinity demo information#
In sept 2021, 🤗 Hugging Face released a new product called Infinity.
It’s described as a server to perform inference at enterprise scale.
The communication is around the promise that the product can perform Transformer inference at 1 millisecond latency on the GPU.
There are very few information about its performances outside this YouTube video:
demo video (Youtube)
According to the demo presenter,  Hugging Face Infinity server costs at least 💰20 000$/year for a single model deployed on a single machine (no information is publicly available on price scalability).
In the next parts we will try to compare this open source library with the commercial solution from Hugging Face.
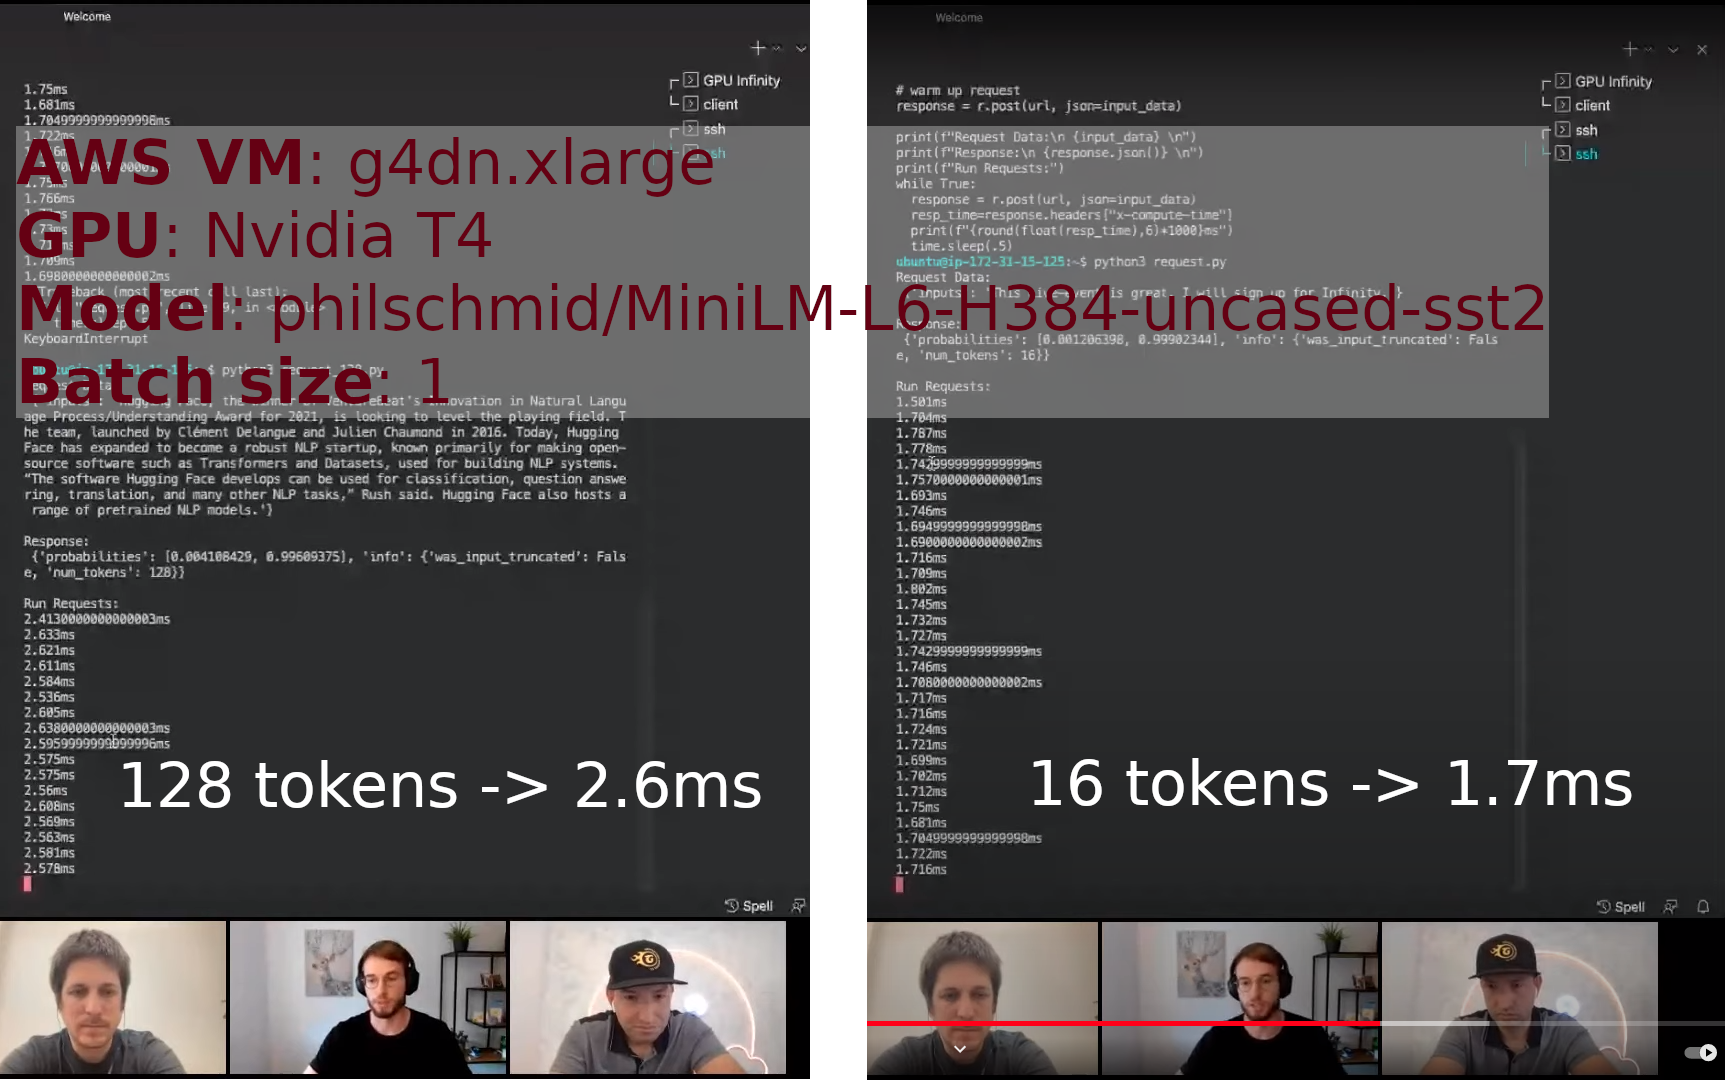
Setup they used for their own demo:
| AWS instance | GPU | model | seq len | batch size | latency |
|---|---|---|---|---|---|
| g4dn x.large | Nvidia T4 | philschmid/MiniLM-L6-H384-uncased-sst2 | 16 | 1 | 1.7ms |
| g4dn x.large | Nvidia T4 | philschmid/MiniLM-L6-H384-uncased-sst2 | 128 | 1 | 2.5ms |
The purpose of this tutorial is to explain how to heavily optimize a Transformer from Hugging Face and deploy it on a production-ready inference server, end to end.
The performance improvement brought by this process applies to all scenarios, from short sequences to long ones, from a batch of size 1 to large batches. When the architecture is compliant with the expectations of the tools, the process always brings a significant performance boost compared to vanilla PyTorch.
The process is in 3 steps:
- convert Pytorch model to a graph
- optimize the graph
- deploy the graph on a performant inference server
At the end we will compare the performance of our inference server to the numbers shown by Hugging Face during the demo and will see that we are faster for both 16 and 128 tokens input sequences with batch size 1 (as far as I know, Hugging Face has not publicly shared information on other scenarios).
Model optimization#
We will optimize philschmid/MiniLM-L6-H384-uncased-sst2 model from the Hugging Face hub.
We will use the 3 backends for that: ONNX Runtime, TensorRT and Pytorch.
Usually, ONNX Runtime provide a good trade-off between simplicity and performance, TensorRT the best performances
and Pytorch the simplest approach (at least it's the most well known tool).
# add -v $PWD/src:/opt/tritonserver/src to apply source code modification to the container
docker run -it --rm --gpus all \
  -v $PWD:/project ghcr.io/els-rd/transformer-deploy:0.4.0 \
  bash -c "cd /project && \
    convert_model -m \"philschmid/MiniLM-L6-H384-uncased-sst2\" \
    --backend tensorrt onnx \
    --seq-len 16 128 128"
16 128 128 means that the TensorRT model will optimize for a sequence length between 16 and 128 tokens. Most of the time it's a bad idea to use dynamic axis on sequence length, it makes TensorRT slower. ONNX Runtime don't use this information and it has no impact on it.
After a few minutes, it should display something like this:
Inference done on Tesla T4
latencies:
[TensorRT (FP16)] mean=1.00ms, sd=0.13ms, min=0.92ms, max=1.34ms, median=0.95ms, 95p=1.31ms, 99p=1.33ms
[ONNX Runtime (vanilla)] mean=1.67ms, sd=0.08ms, min=1.59ms, max=3.48ms, median=1.65ms, 95p=1.85ms, 99p=1.87ms
[ONNX Runtime (optimized)] mean=0.73ms, sd=0.01ms, min=0.71ms, max=0.87ms, median=0.73ms, 95p=0.75ms, 99p=0.76ms
[Pytorch (FP32)] mean=5.13ms, sd=0.06ms, min=5.06ms, max=6.85ms, median=5.13ms, 95p=5.18ms, 99p=5.22ms
[Pytorch (FP16)] mean=5.39ms, sd=0.10ms, min=5.31ms, max=8.39ms, median=5.39ms, 95p=5.45ms, 99p=5.48ms
interesting to note that ONNX Runtime provide better performances than TensorRT for this setup, it's quite rare...
Models are stored in newly generated ./triton_models/ folder.
Subfolders contain templates for Nvidia Triton server.
Launch Nvidia Triton inference server#
⚠️WARNING⚠️: if you have generated the models outside the Docker container, check that your TensorRT version is the same than the Triton backend one.
Launch Nvidia Triton inference server:
# add --shm-size 256m -> to have up to 4 Python backends (tokenizer) at the same time (64Mb per instance)
docker run -it --rm --gpus all -p8000:8000 -p8001:8001 -p8002:8002 --shm-size 256m \
  -v $PWD/triton_models:/models nvcr.io/nvidia/tritonserver:22.01-py3 \
  bash -c "pip install transformers && tritonserver --model-repository=/models"
As you can see we install Transformers and then launch the server itself. This is of course a bad practice, you should make your own 2 lines Dockerfile with Transformers inside.
Performance analysis#
Measures:
-
16 tokens + TensorRT:
# need a local installation of the package # pip install .[GPU] ubuntu@ip-XXX:~/transformer-deploy$ python3 demo/infinity/triton_client.py --length 16 --model tensorrt 10/31/2021 12:09:34 INFO timing [triton transformers]: mean=1.53ms, sd=0.06ms, min=1.48ms, max=1.78ms, median=1.51ms, 95p=1.66ms, 99p=1.74ms [[-3.4355469 3.2753906]] -
128 tokens + TensorRT:
There is also a performance analysis tool provided by Nvidia called perf_analyzer
# perf_analyzer needs this dependency
sudo apt install libb64-dev
# add -a for async measures, and -i grpc to use that protocol instead of http
~/.local/bin/perf_analyzer -m transformer_tensorrt_inference \
  --percentile=95 \
  --string-data "This live event is great. I will sign-up for Infinity." \
  --shape TEXT:1 \
  --concurrency-range 1:4 \
  -i grpc \
  -a \
  -f perf.csv

# just test the model part (easier to get random input)
~/.local/bin/perf_analyzer --input-data zero -m transformer_tensorrt_model \
  --shape input_ids:1,128 \
  --shape attention_mask:1,128 \
  --shape token_type_ids:1,128 \
  --concurrency-range 1:4 \
  -i grpc \
  -a \
  -f perf.csv
The tool need to be run on Ubuntu >= 20.04 (and won't work on Ubuntu 18.04 used for the AWS official Ubuntu deep learning image)
Model analyzer#
Model analyzer is a powerful tool to adjust the Triton server configuration. To run it:
docker run -it --rm --gpus all -v $PWD:/project ghcr.io/els-rd/transformer-deploy:0.1.1 \
  bash -c "model-analyzer profile -f /project/demo/infinity/config_analyzer.yaml"
FastAPI server baseline#
This is our baseline, easy to run, but not very performant.
# launch server, disable logging for best performances
python3 -m uvicorn --log-level warning demo.infinity.fast_api_server_onnx:app --port 8000 --host 0.0.0.0
# other variation, 1 worker per CPU for best latency (plus not a good idea to have several times the same model on a single GPU):
python3 -m gunicorn -w 1 -k uvicorn.workers.UvicornWorker --log-level warning demo.infinity.fast_api_server_onnx --bind 0.0.0.0:8000

# simple inference timing
time curl -G --data-urlencode query="This live event is great. I will sign-up for Infinity." localhost:8000/predict
# slightly more serious measure
sudo apt-get install linux-tools-common linux-tools-generic linux-tools-`uname -r`
sudo perf stat -r 50 -d curl -G --data-urlencode query="This live event is great. I will sign-up for Infinity." localhost:8000/predict -s > /dev/null
It should produce:
Performance counter stats for 'curl -G --data-urlencode query=This live event is great. I will sign-up for Infinity. localhost:8000/predict' (50 runs):

              6.14 msec task-clock                #    0.494 CPUs utilized            ( +-  0.59% )
                 3      context-switches          #    0.462 K/sec                    ( +-  1.84% )
                 0      cpu-migrations            #    0.000 K/sec
               577      page-faults               #    0.094 M/sec                    ( +-  0.06% )
   <not supported>      cycles
   <not supported>      instructions
   <not supported>      branches
   <not supported>      branch-misses
   <not supported>      L1-dcache-loads
   <not supported>      L1-dcache-load-misses
   <not supported>      LLC-loads
   <not supported>      LLC-load-misses

         0.0124429 +- 0.0000547 seconds time elapsed  ( +-  0.44% )